loader image

Market share and aisle share: Category analytics for CPG Industry

Reading Time: 5 minutes

Consumer Packaged Goods (CPG) companies, rarely have visibility of their market, competitors, or selling patterns because they depend on retailers as their end-customer. The presence of retailers in the process of selling CPG products to end consumers creates the need for multiple varied data access for CPG companies. As such, retail audit data provides visibility across product hierarchies, channels and areas. For example, since CPG companies rely on retailer data, they need to utilize their most accurate sources, like household panel data, to understand customer penetration, frequency, etc., across multiple hierarchies. It is of utmost importance for a category manager at a CPG company to analyze these datasets with multiple other datasets like media, leaflets, perfect store, EPOS, etc, and obtain business insights from it.

Analyzing market share: Why is it necessary?

For CPG category managers seeking to improve their sales performance and market share, the quickest route to success is often decoding business insights from category analysis focusing on increasing sales value and market share. This is successful when backed by exceptional product quality, product presence in stock, customer penetration, and share of aisle.

Analyzing market share is an industry-wide challenge impacting multiple functions. It affects the:

  • Product
  • Rate of sales
  • Weighted distribution
  • Frequency of customers
  • Spend per visit

Considering the differing objectives across functions to derive actionable insights, the market share is often looked at with inter-dependent functional data residing in disparate systems. This departmentalized approach to analysis forces the aggregation of data and information to a very high level.

This limits the ability to:

  • Track, trace, and analyze (on a single pane of glass) disparate data in the market share and take business decisions accordingly.
  • Quickly identify the root cause of complex systems and increase sales across channels and products.
  • Identify the erroneous sub-brands/variations and performances.
  • Detect and avoid hurdles in the sales cycle across retailers before they occur.

Fortunately for the business leaders tasked with managing and increasing market share, customer penetration, frequency, and share of aisle, there is hope. It comes in the form of Decision Intelligence platforms like Fosfor Lumin.

The data

This blog post presents Lumin’s capability to analyze the category sales data for a global CPG company. Capacities of Lumin by Fosfor include:

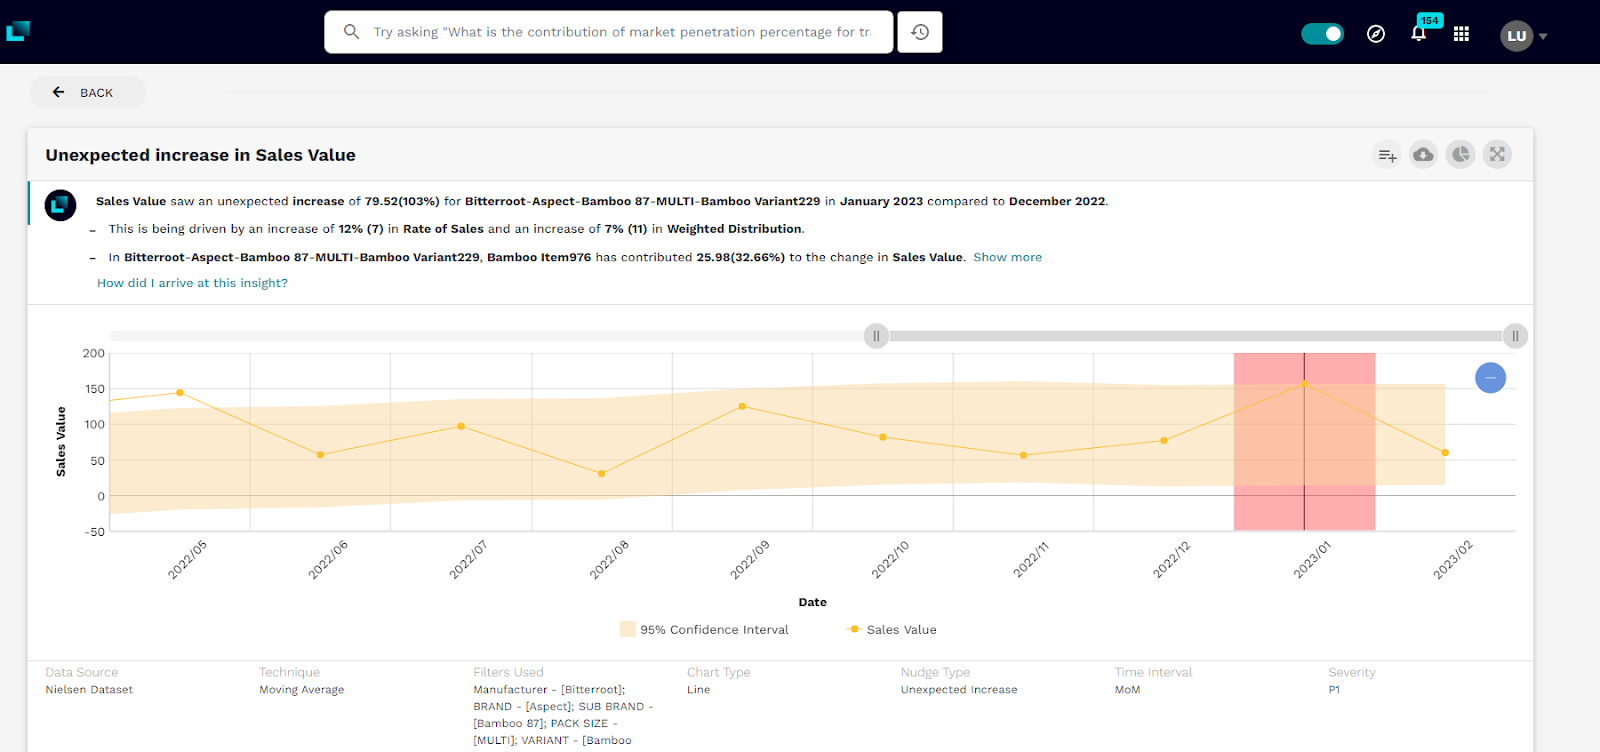
  • Proactively identifying anomalistic trends in sales value and subsequent diagnosis across channels, product hierarchy, pack type, variant, etc.
  • Identification of the market share drivers and simulation of their impact on sales.
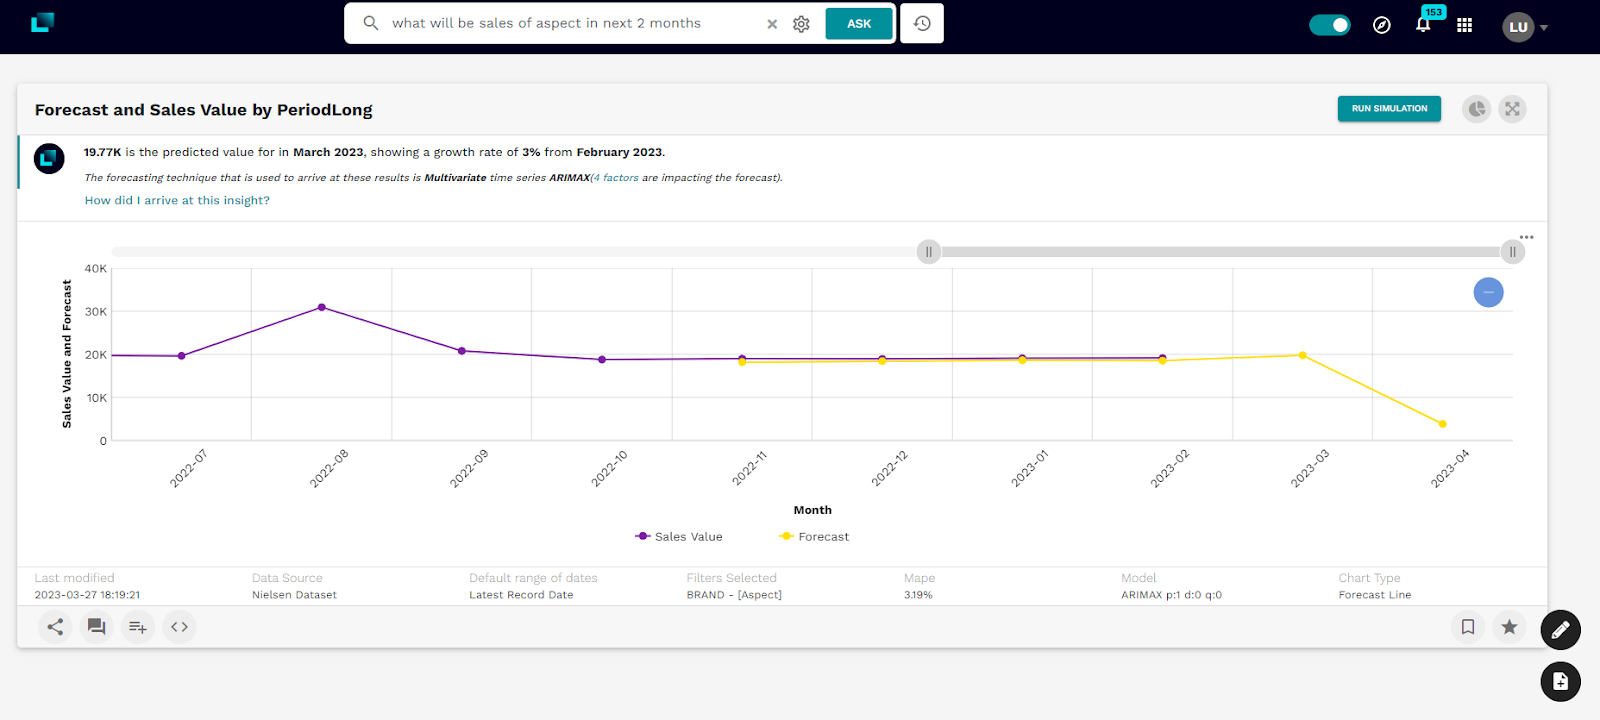
  • Accurate prediction of the overall sales through multivariate forecasting.

Our dummy data consists of retail audits, household panels, and multiple internal data sources, i.e., EPOS system and the perfect store system. This data will be hosted on a cloud data warehouse (AWS Redshift) as virtualized views or reflections. The data’s schema consists of monthly market share data across different attributes. Key attributes include:

  • Key dimensions: Product type, pack type manufacturer, brand, sub-brand, pack size, variant, retailer, trade, etc.
  • Key measures: Market share, sales value, share of aisle, etc.
  • Date dimension: Audit dates

Descriptive analytics to help CPG companies explore the market share data

Let’s explore the data for the market share by brands in February 2023. We will start with a simple descriptive analysis by asking a few questions below.

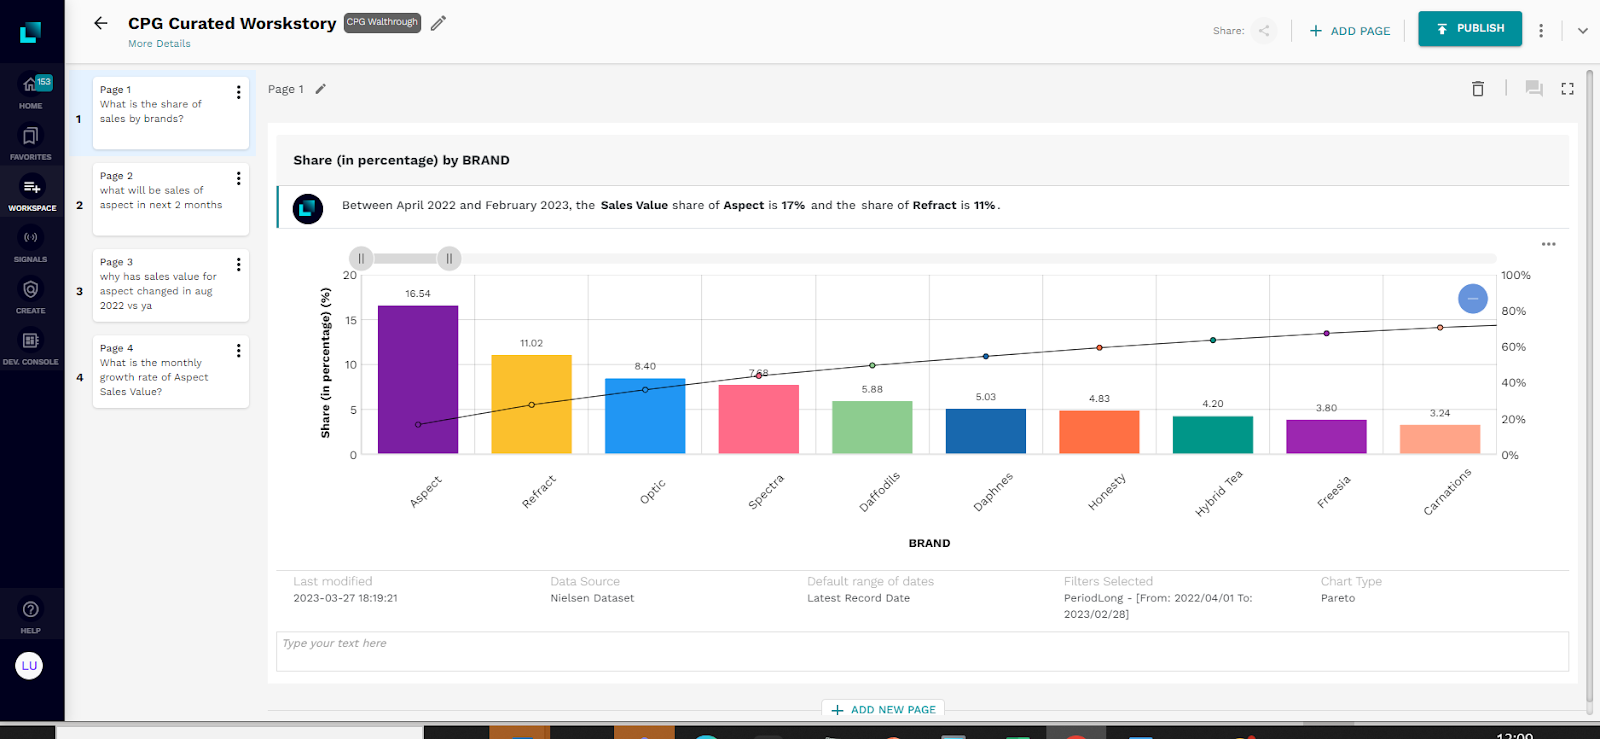
What is the share of sales by brands?

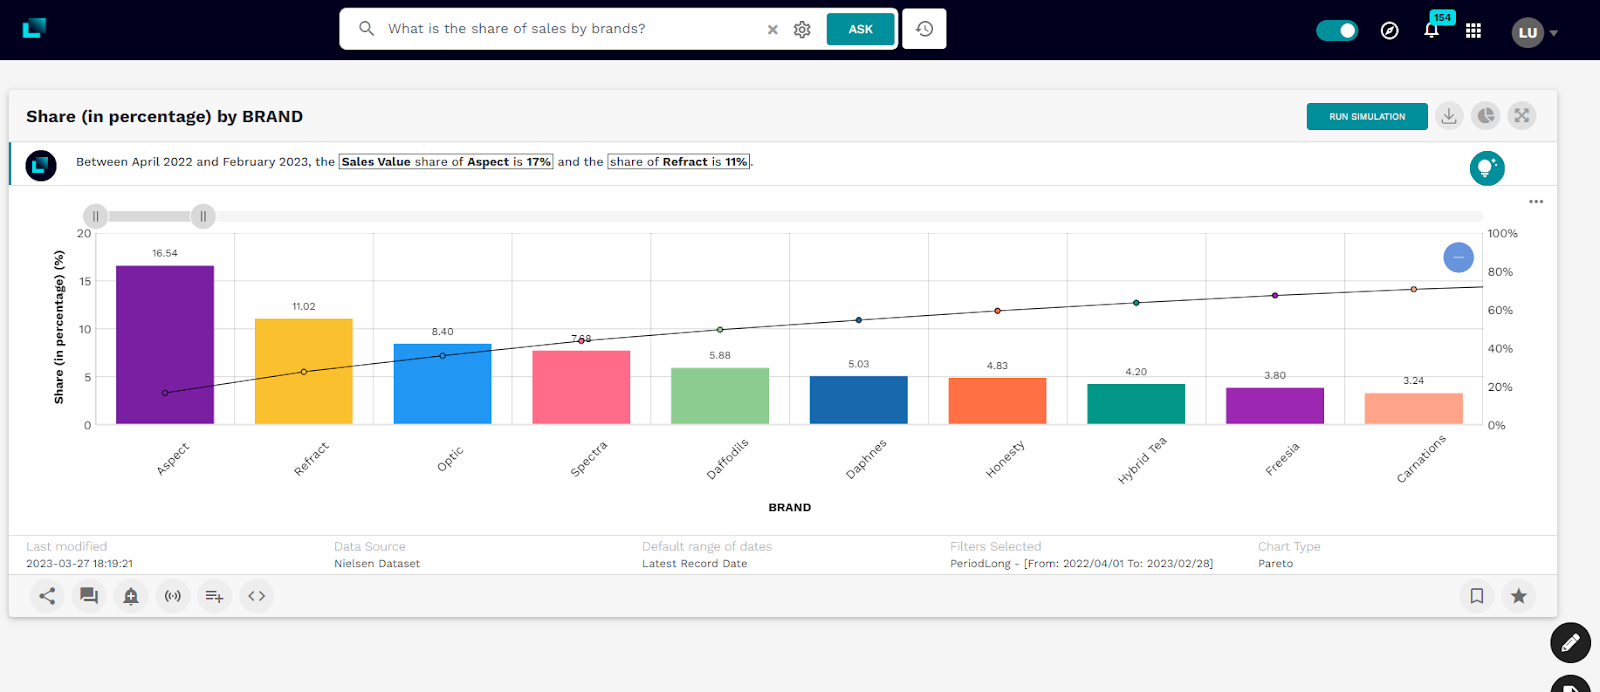
Image 1: Share of sales

Fosfor Lumin understood our question in natural language and converted it into an analytical query along with the time filter. Lumin clearly calls out in Image 1 that Aspect is the market leader with the majority market share. It would be interesting to understand its spread across the different time frames. As a business, taking business decisions by looking out for sales value trends and understanding growth rates is essential.

By clicking the connected insights button, Lumin provides a set of simple and advanced analytical questions closely related to the metric or KPI being explored. Connected insights also suggest the growth rate in Lumin.

Image 2: Connected decision insights

As the next logical step, as seen in Image 2, it would be prudent to identify the trend where the highest share in sales has been observed. We ask Lumin this next question.

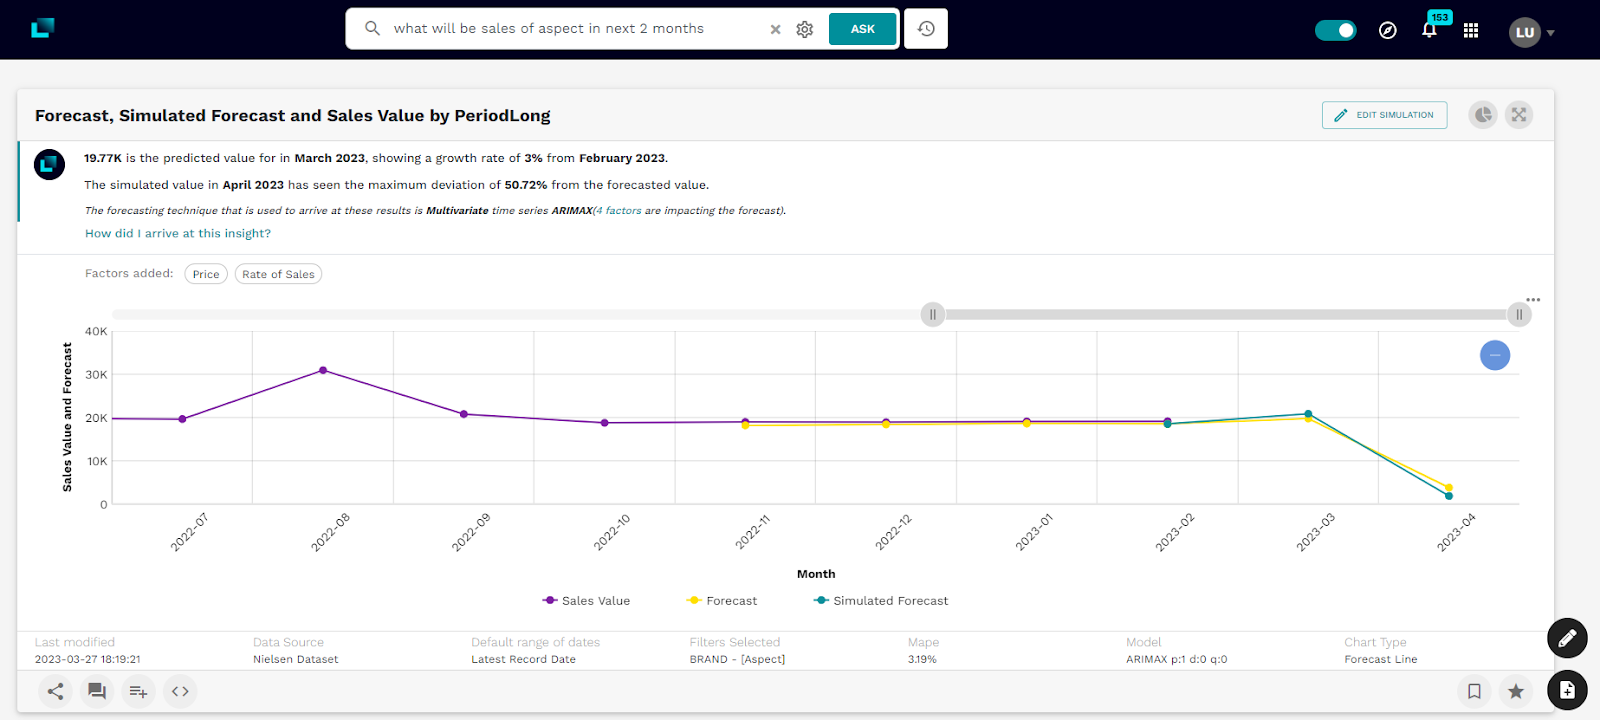
What is the monthly growth rate of Aspect’s sales value?

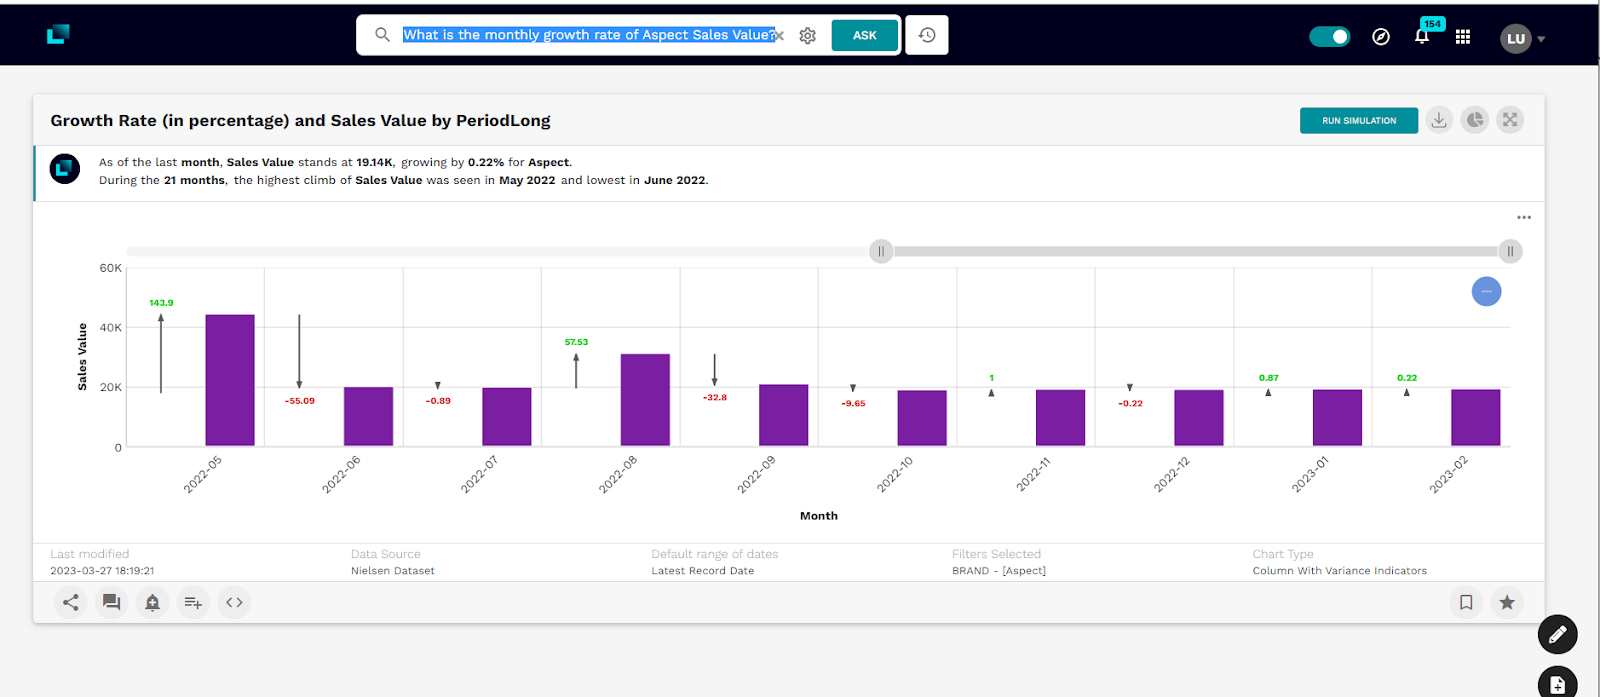
Image 3: Growth rate of Aspect. This Image also highlights a few features of Lumin viz, data export, chart switcher and download data

It is worth noting that Lumin also allows to:

  • Export the underlying data
  • Flexibility to switch the chart visualization

As you can see in Image 3, Fosfor Lumin dynamically selected the best-fit visualization to present the insight while also generating a contextualized narrative (in English) to explain the same. It is evident that August 2022 has shown a huge increase in sales. This information is interesting because it allows users to understand what drives this increase and from when. Since August has witnessed growth, why not explore the different pack sizes that contributed most to this outcome?

What is the growth contribution to overall sales for pack size in September 2022?

Lumin provides users with some powerful collaboration features to do the following:

  • Share the business decision insights with our colleagues within the organization.
  • Add comments (our understanding, observations, POV, etc.) on the insights while collaborating with a larger team.
  • Create personalized alerts and signals to better track the metrics or KPIs. We can get notified when our metrics breach a threshold that we can define.
  • Capture the insights in an insights storyboard called a workspace as we go about our exploratory journey. The workspace can further be shared with our colleagues within the organization.

As a collaborating user, I would expect Lumin to show me a waterfall chart. It does exactly that. Lumin’s semantic model understands common business terminologies like ratio, share, contribution, top or bottom N, etc. Furthermore, it does not need to be separately trained on that. As is evident from Image 4, the large pack size has contributed the highest to growth, whereas the multi-pack size negatively impacted it.

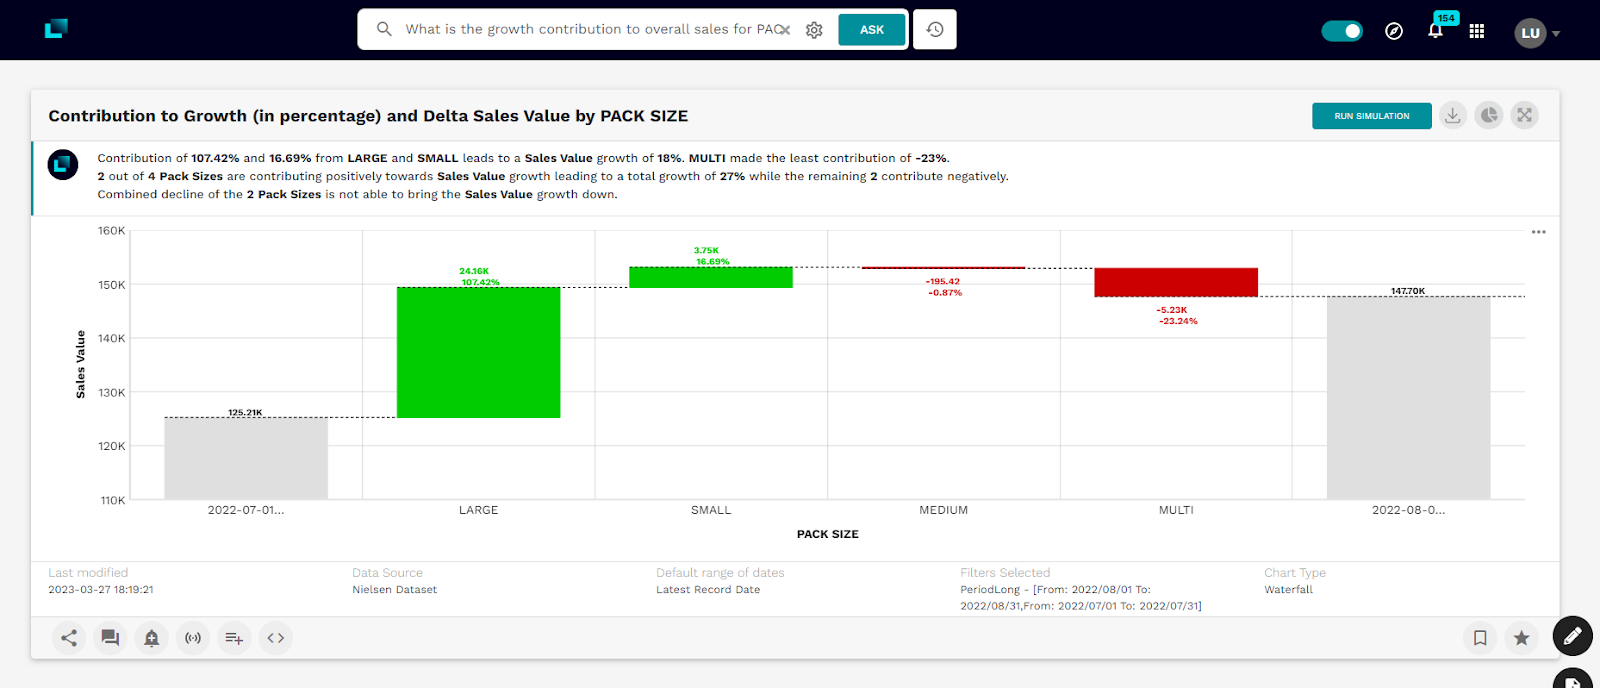
Image 4: Waterfall chart to depict the pack size impact on growth distribution in Aug 2022

Since we know the greatest change was observed in August 2022, the next obvious question would be: Why has the Sales value for Aspect changed in Aug 2022 vs. a year ago? To answer this, we can ask Lumin the following question.

Why has the sales value for Aspect changed in Aug 2022 vs. a year ago?

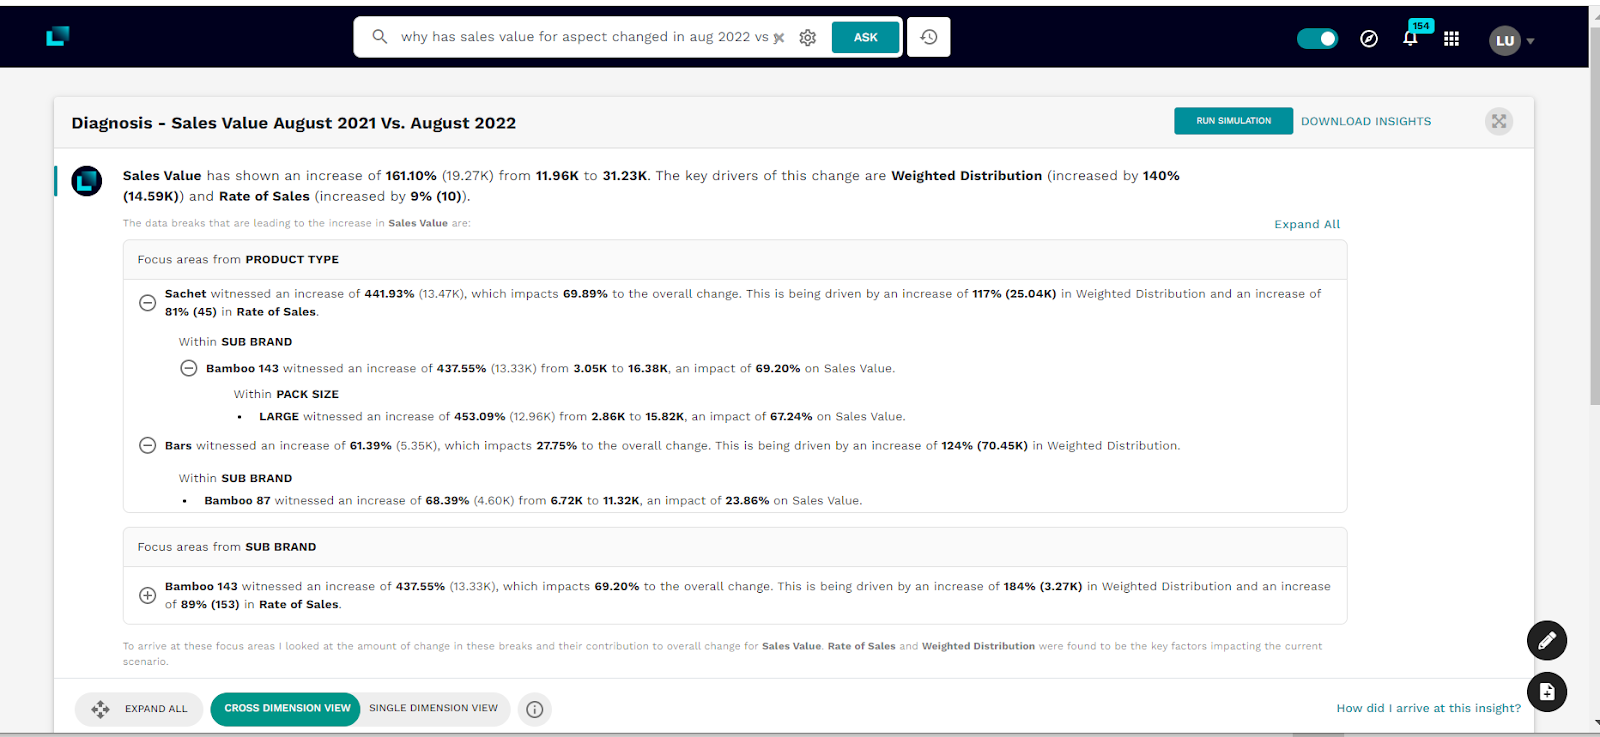
  Image 5: Diagnostic of change in sales in 2022

As seen in Image 5, Lumin – the Decision Intelligence platform, performs a cross-dimensional sales value analysis. This includes the product hierarchy (manufacturer, brand, variant) and product size. It also includes a type apart from the geographical hierarchy, evaluating across channels and trades we have already analyzed. In a matter of a few seconds, Lumin presents a detailed narrative and an interactive bubble chart that presents the deep-dive analysis across multiple levels, like product, manufacturer, and size.

For example, if we look through the product lens, we understand that the Sachet product type model contributed the most to the sales increase. The weighted distribution and rate of sales drove it. Also, for Bamboo 143, the sales value was the highest in the sachet for a large pack size.

Now as users, we can very well question these findings. As such, Lumin’s explainability layer becomes very important. It provides users with explanations on how it arrived at these insights, i.e., what was the input data, its sanity, the model that was applied, how we can interpret that model, its reliability, etc.

Now that we know the drivers for sales, we can simulate the same for Aspect by changing the drivers, e.g., reducing the weighted distribution and rate of sales by -10%.

Image 6: Simulation

As is evident from Image 6, a -10% reduction in the sales rate and weighted distribution further reduces sales by 9.2%. We can click on the “How did I arrive at the insight?” link to understand the computation Fosfor Lumin performed to simulate the results.

As we have seen the causes of change in sales of Aspect, why not explore other data sources to learn more about them? With Lumin, you only need to ask the question to land on another data source.

What is the trend of penetration and spend of Aspect?

Image 7: Trend on household panel data

The insight in Image 6 suggests that the penetration has been relatively constant, whereas the spend per visit has reduced. This suggests customer frequency has increased. That is why sales are increasing even though spending per visit has reduced. This environment essentially creates a change either in promotion or placement. Let’s explore the placement with its presence in perfect store data.

What is the share of main aisle by accounts for Aspect in Aug 2022 vs. July 2022?

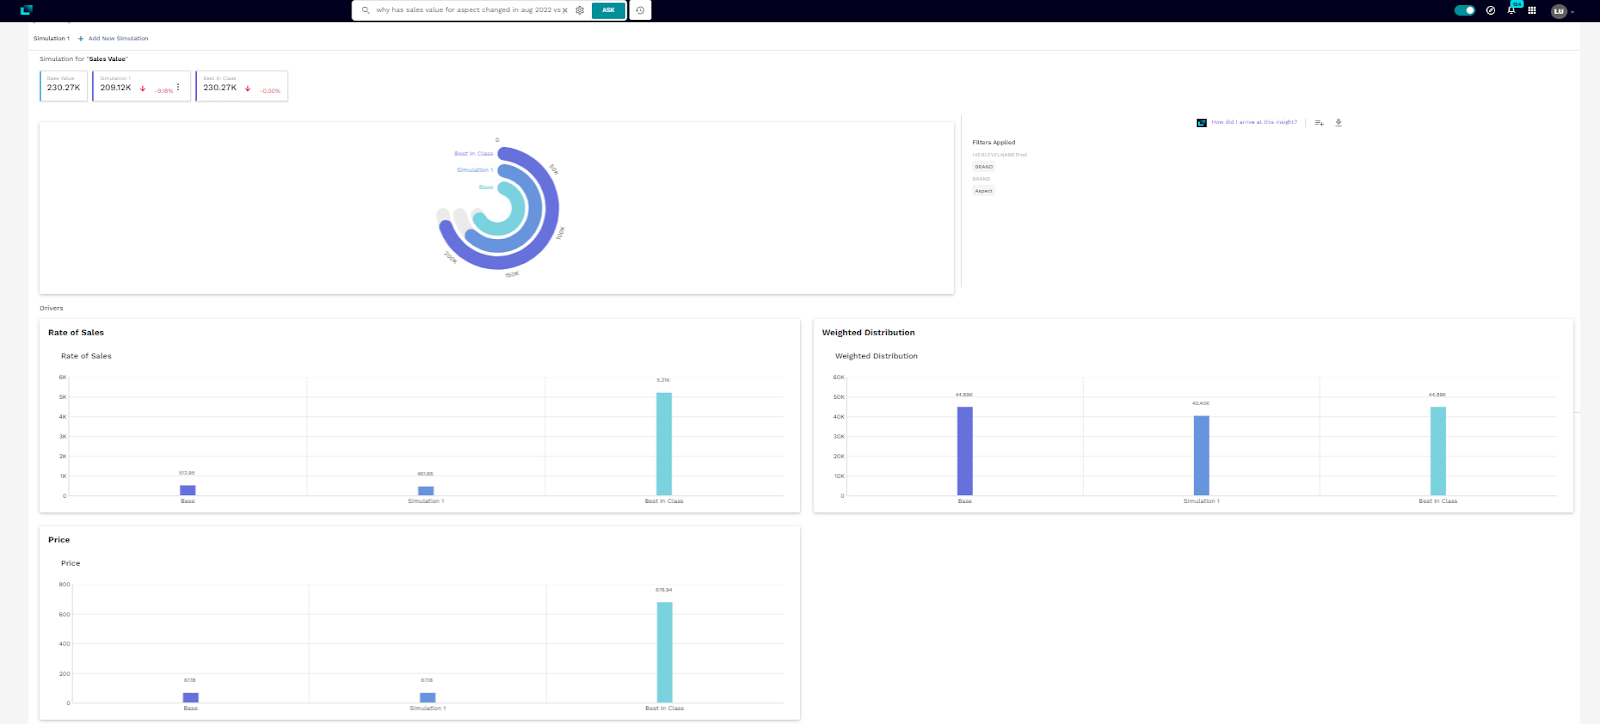
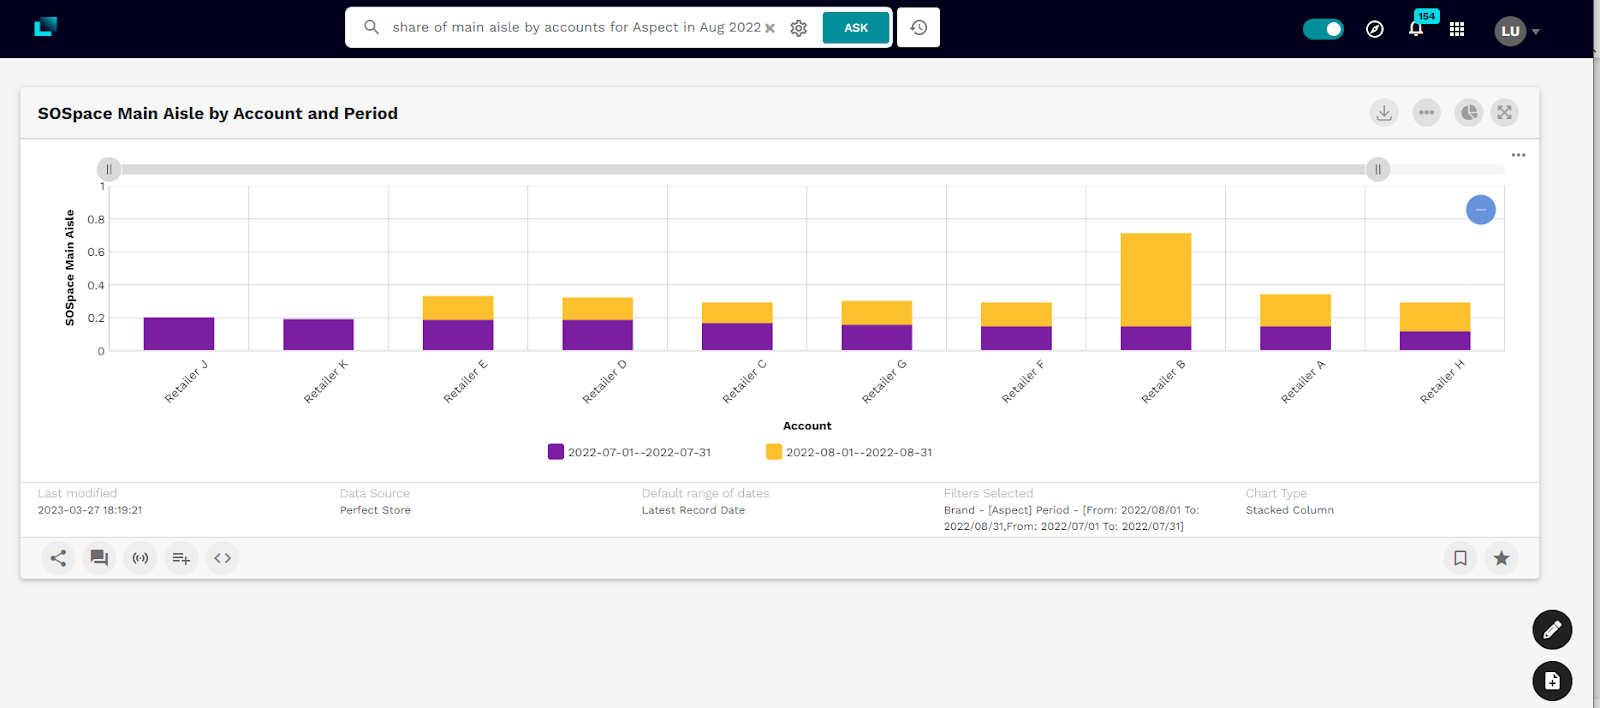
Image 8: Retailer with maximum Change in Share of Aisle for Aspect

As evident from the Sales chart in Image 7, retailer B drove the increase in share of aisle in Aug 2022.

Never miss a critical change in your sales value with autonomous nudges

We can continue even further and ask even more questions. We can probe the data for more deep-dive analyses across various dimensions. We started our analysis by looking at a geographical cut. Still, we can very well look at manufacturers and brands, product types, package types, etc., and arrive at granular insights enabling increased confidence in enterprise decision-making.

Still, what if Fosfor Lumin could have autonomously detected and nudged us on this anomalistic trend? Is this possible? Yes, Lumin can spot deviations in our data as they happen with fully automated ‘nudges.’ Lumin’s anomaly engine synthesizes millions of data points in seconds to inform business users of significant changes as they happen. It detects what had shifted, when, why this occurred, and by how much.

Lumin has a robust setup of autonomous nudges on sales value. It configures this information to look out for anomalistic behavior in sales value across the product hierarchy comprising manufacturer, brand, and sub-brand. In this use case, Lumin proactively detected the sudden increase in sales in Bitterroot-Aspect-bamboo 87, as seen in Image 9. Lumin discovered that a higher rate of sales caused the increase. Additionally, the multi-variant has contributed the most to the rise.


Image 9: Autonomous nudge detected the unexpected increase in Jan 2023 in Aspect

Effectively, autonomous nudges proactively surfaced the anomaly for which we had to otherwise ask multiple questions on Lumin.

Get a sneak peek into future sales using predictive analytics

Last but not least, it will be crucial to understand how Aspect’s sales value will trend over the next few months. This will help businesses to be better prepared (in terms of reserves) to manage a possible increase in spending. Let us ask Fosfor Lumin to forecast the sales of Aspect.

What will be the sales of Aspect in the next two months?


Image 10: Forecast of Sales of Aspect

Image 11: Explainability of forecast

Lumin by Fosfor understands that we are asking it to predict the sales of Aspect. It runs multiple multivariate forecasting models under the hood and presents the most accurate model as an output. For our question, Lumin selected the multivariate time series ARIMAX model for predicting Sales, and it also identified the part cost and labor cost as the key drivers impacting the forecast.

As explained before, Lumin provides a detailed explanation in Image 11 of the input data. It provides the sanity, the prediction models it applied (including accuracy), how we interpret them, and the reliability of those models. This provides transparency of the model used and explains to the end user why to rely on model accuracy.

However, as a business, if we are aware that the rate of sales and price per volume are expected to increase in the next three months, it would be important for us to factor that increase into our forecast to make it realistic. Since we know that the price per volume is supposed to increase along with the sales rate, let us increase them to $125 and $700 in the next two months and simulate the output.

Image 12: Forecast simulation

As you can see, Fosfor Lumin factored in the increase in the drivers and reworked the forecast for us. The forecasted values have increased compared to the earlier forecast. This is more realistic and closer to what the business would expect. Lumin also helps end consumers understand the impact of variables, which could be changed by changing the drivers.

Create, curate, and collaborate on your business insights story

The entire analysis in this blog not only asked questions but gave an insightful data story that can be shared with the relevant stakeholders across your organization. Lumin, through the workspace storyboards, enables us to seamlessly create, curate and collaborate with our colleagues in the organization.


Image 13: Workspace storyboard

As we traverse through our insights exploration journey, we can create a personalized workspace and add our insights to that workspace. Once the analysis is complete, we can visit our workspace to refine or curate our story, add comments, etc., before publishing it to the stakeholders. Once published, the workspace is refreshed every time the underlying data is refreshed. Isn’t that amazing?

Lumin: The category analysis solution

As we showcased above, Lumin is a Decision Intelligence platform that delivers value across the category analysis and cause-effect in the sales journey of the CPG industry by providing category, brand, and marketing teams with a unified analytics experience across data sources. It can curate faster answers to what happened with a Google-like conversational interface. It explains business metric changes and how to improve business outcomes by understanding the drivers of those behaviors.

Author

Shashank Pushp

Solution Architect Fosfor, LTI Mindtree

With over a decade of experience in Retail and CPG analytics, Shashank is known for assisting large organizations across industries get more out of their data. He is the Solutions Architect of the Decision Intelligence platform, Lumin at Fosfor. He is a data enthusiast and product evangelist, empowering customers with actionable data stories. When not at work, Shashank explores new travel destinations, reads drama, and watches stand-up comedies.

More on the topic

Read more thought leadership from our team of experts

How can Retail and CPG companies utilize ChatGPT and Generative AI

OpenAI, an American artificial intelligence research laboratory, released ChatGPT on 30 November 2022, and there has been an uptick in interest around the world on AI-generated text, AI-generated images, and AI-generated video ever since. This interest has gained traction over time, fueled by the potential for it to change our lives forever - professional and personal alike.

Read more

From data silos to decision intelligence - A playbook for CPG leaders

Learn how Decision Intelligence can help CPG brand and category leaders gain the agility they require to succeed.

Read more

Introduction to Decision Intelligence and its tools

The pandemic has completely transformed the way we live life and do business. Over the last two years, we have learned how important it is to be flexible and agile in our decision-making. According to a recent survey by Gartner, "65% of respondents said the decisions they make are more complex than just two years ago, and 53% said they face more pressure to explain or justify their decisions."

Read more
We use cookies to personalise content and ads, to provide social media features and to analyse our traffic. We also share information about your use of our site with our social media, advertising and analytics partners. View more
Cookies settings
Accept
Privacy & Cookie policy
Privacy & Cookies policy
Cookie name Active

What is a cookie?

A cookie is a small piece of data that a website asks your browser to store on your computer or mobile device. The cookie allows the website to “remember” your actions or preferences over time. On future visits, this data is then returned to that website to help identify you and your site preferences. Our websites and mobile sites use cookies to give you the best online experience. Most Internet browsers support cookies; however, users can set their browsers to decline certain types of cookies or specific cookies. Further, users can delete cookies at any time.

Why do we use cookies?

We use cookies to learn how you interact with our content and to improve your experience when visiting our website(s). For example, some cookies remember your language or preferences so that you do not have to repeatedly make these choices when you visit one of our websites.

What kind of cookies do we use?

We use the following categories of cookie:

Category 1: Strictly Necessary Cookies

Strictly necessary cookies are those that are essential for our sites to work in the way you have requested. Although many of our sites are open, that is, they do not require registration; we may use strictly necessary cookies to control access to some of our community sites, whitepapers or online events such as webinars; as well as to maintain your session during a single visit. These cookies will need to reset on your browser each time you register or log in to a gated area. If you block these cookies entirely, you may not be able to access gated areas. We may also offer you the choice of a persistent cookie to recognize you as you return to one of our gated sites. If you choose not to use this “remember me” function, you will simply need to log in each time you return.
Cookie Name Domain / Associated Domain / Third-Party Service Description Retention period
__cfduid Cloudflare Cookie associated with sites using CloudFlare, used to speed up page load times 1 Year
lidc linkedin.com his is a Microsoft MSN 1st party cookie that ensures the proper functioning of this website. 1 Day
PHPSESSID lntinfotech.com Cookies named PHPSESSID only contain a reference to a session stored on the web server When the browsing session ends
catAccCookies lntinfotech.com Cookie set by the UK cookie consent plugin to record that you accept the fact that the site uses cookies. 29 Days
AWSELB Used to distribute traffic to the website on several servers in order to optimise response times. 2437 Days
JSESSIONID linkedin.com Preserves users states across page requests. 334,416 Days
checkForPermission bidr.io Determines whether the visitor has accepted the cookie consent box. 1 Day
VISITOR_INFO1_LIVE Tries to estimate users bandwidth on the pages with integrated YouTube videos. 179 Days
.avia-table-1 td:nth-of-type(1):before { content: 'Cookie Name'; } .avia-table-1 td:nth-of-type(2):before { content: 'Domain / Associated Domain / Third-Party Service'; } .avia-table-1 td:nth-of-type(3):before { content: 'Description'; } .avia-table-1 td:nth-of-type(4):before { content: 'Retention period'; }

Category 2: Performance Cookies

Performance cookies, often called analytics cookies, collect data from visitors to our sites on a unique, but anonymous basis. The results are reported to us as aggregate numbers and trends. LTI allows third-parties to set performance cookies. We rely on reports to understand our audiences, and improve how our websites work. We use Google Analytics, a web analytics service provided by Google, Inc. (“Google”), which in turn uses performance cookies. Information generated by the cookies about your use of our website will be transmitted to and stored by Google on servers Worldwide. The IP-address, which your browser conveys within the scope of Google Analytics, will not be associated with any other data held by Google. You may refuse the use of cookies by selecting the appropriate settings on your browser. However, you have to note that if you do this, you may not be able to use the full functionality of our website. You can also opt-out from being tracked by Google Analytics from any future instances, by downloading and installing Google Analytics Opt-out Browser Add-on for your current web browser: https://tools.google.com/dlpage/gaoptout & cookiechoices.org and privacy.google.com/businesses
Cookie Name Domain / Associated Domain / Third-Party Service Description Retention period
_ga lntinfotech.com Used to identify unique users. Registers a unique ID that is used to generate statistical data on how the visitor uses the web site. 2 years
_gid lntinfotech.com This cookie name is asssociated with Google Universal Analytics. This appears to be a new cookie and as of Spring 2017 no information is available from Google. It appears to store and update a unique value for each page visited. 1 day
_gat lntinfotech.com Used by Google Analytics to throttle request rate 1 Day
.avia-table-2 td:nth-of-type(1):before { content: 'Cookie Name'; } .avia-table-2 td:nth-of-type(2):before { content: 'Domain / Associated Domain / Third-Party Service'; } .avia-table-2 td:nth-of-type(3):before { content: 'Description'; } .avia-table-2 td:nth-of-type(4):before { content: 'Retention period'; }

Category 3: Functionality Cookies

We may use site performance cookies to remember your preferences for operational settings on our websites, so as to save you the trouble to reset the preferences every time you visit. For example, the cookie may recognize optimum video streaming speeds, or volume settings, or the order in which you look at comments to a posting on one of our forums. These cookies do not identify you as an individual and we don’t associate the resulting information with a cookie that does.
Cookie Name Domain / Associated Domain / Third-Party Service Description Retention period
lang ads.linkedin.com Set by LinkedIn when a webpage contains an embedded “Follow us” panel. Preference cookies enable a website to remember information that changes the way the website behaves or looks, like your preferred language or the region that you are in. When the browsing session ends
lang linkedin.com In most cases it will likely be used to store language preferences, potentially to serve up content in the stored language. When the browsing session ends
YSC Registers a unique ID to keep statistics of what videos from Youtube the user has seen. 2,488,902 Days
.avia-table-3 td:nth-of-type(1):before { content: 'Cookie Name'; } .avia-table-3 td:nth-of-type(2):before { content: 'Domain / Associated Domain / Third-Party Service'; } .avia-table-3 td:nth-of-type(3):before { content: 'Description'; } .avia-table-3 td:nth-of-type(4):before { content: 'Retention period'; }

Category 4: Social Media Cookies

If you use social media or other third-party credentials to log in to our sites, then that other organization may set a cookie that allows that company to recognize you. The social media organization may use that cookie for its own purposes. The Social Media Organization may also show you ads and content from us when you visit its websites.

Ref links:

LinkedInhttps://www.linkedin.com/legal/privacy-policy Twitterhttps://gdpr.twitter.com/en.html & https://twitter.com/en/privacy & https://help.twitter.com/en/rules-and-policies/twitter-cookies Facebookhttps://www.facebook.com/business/gdpr Also, if you use a social media-sharing button or widget on one of our sites, the social network that created the button will record your action for its own purposes. Please read through each social media organization’s privacy and data protection policy to understand its use of its cookies and the tracking from our sites, and also how to control such cookies and buttons.

Category 5: Targeting/Advertising Cookies

We use tracking and targeting cookies, or ask other companies to do so on our behalf, to send you emails and show you online advertising, which meet your business and professional interests. If you have registered on our websites, we may send you emails, tailored to reflect the interests you have shown during your visits. We ask third-party advertising platforms and technology companies to show you our ads after you leave our sites (retargeting technology). This technology allows us to make our website services more interesting for you. Retargeting cookies are used to record anonymized movement patterns on a website. These patterns are used to tailor banner advertisements to your interests. The data used for retargeting is completely anonymous, and is only used for statistical analysis. No personal data is stored, and the use of the retargeting technology is subject to the applicable statutory data protection regulations. We also work with companies to reach people who have not visited our sites. These companies do not identify you as an individual, instead rely on a variety of other data to show you advertisements, for example, behavior across websites, information about individual devices, and, in some cases, IP addresses. Please refer below table to understand how these third-party websites collect and use information on our behalf and read more about their opt out options.
Cookie Name Domain / Associated Domain / Third-Party Service Description Retention period
BizoID ads.linkedin.com These cookies are used to deliver adverts more relevant to you and your interests 183 days
iuuid demandbase.com Used to measure the performance and optimization of Demandbase data and reporting 2 years
IDE doubleclick.net This cookie carries out information about how the end user uses the website and any advertising that the end user may have seen before visiting the said website. 2,903,481 Days
UserMatchHistory linkedin.com This cookie is used to track visitors so that more relevant ads can be presented based on the visitor’s preferences. 60,345 Days
bcookie linkedin.com This is a Microsoft MSN 1st party cookie for sharing the content of the website via social media. 2 years
__asc lntinfotech.com This cookie is used to collect information on consumer behavior, which is sent to Alexa Analytics. 1 Day
__auc lntinfotech.com This cookie is used to collect information on consumer behavior, which is sent to Alexa Analytics. 1 Year
_gcl_au lntinfotech.com Used by Google AdSense for experimenting with advertisement efficiency across websites using their services. 3 Months
bscookie linkedin.com Used by the social networking service, LinkedIn, for tracking the use of embedded services. 2 years
tempToken app.mirabelsmarketingmanager.com When the browsing session ends
ELOQUA eloqua.com Registers a unique ID that identifies the user’s device upon return visits. Used for auto -populating forms and to validate if a certain contact is registered to an email group . 2 Years
ELQSTATUS eloqua.com Used to auto -populate forms and validate if a given contact has subscribed to an email group. The cookies only set if the user allows tracking . 2 Years
IDE doubleclick.net Used by Google Double Click to register and report the website user’s actions after viewing clicking one of the advertiser’s ads with the purpose of measuring the efficiency of an ad and to present targeted ads to the user. 1 Year
NID google.com Registers a unique ID that identifies a returning user’s device. The ID is used for targeted ads. 6 Months
PREF youtube.com Registers a unique ID that is used by Google to keep statistics of how the visitor uses YouTube videos across different web sites. 8 months
test_cookie doubleclick.net This cookie is set by DoubleClick (which is owned by Google) to determine if the website visitor’s browser supports cookies. 1,073,201 Days
UserMatchHistory linkedin.com Used to track visitors on multiple websites, in order to present relevant advertisement based on the visitor’s preferences. 29 days
VISITOR_INFO1_LIVE youtube.com 179 days
.avia-table-4 td:nth-of-type(1):before { content: 'Cookie Name'; } .avia-table-4 td:nth-of-type(2):before { content: 'Domain / Associated Domain / Third-Party Service'; } .avia-table-4 td:nth-of-type(3):before { content: 'Description'; } .avia-table-4 td:nth-of-type(4):before { content: 'Retention period'; }
Third party companies Purpose Applicable Privacy/Cookie Policy Link
Alexa Show targeted, relevant advertisements https://www.oracle.com/legal/privacy/marketing-cloud-data-cloud-privacy-policy.html To opt out: http://www.bluekai.com/consumers.php#optout
Eloqua Personalized email based interactions https://www.oracle.com/legal/privacy/marketing-cloud-data-cloud-privacy-policy.html To opt out: https://www.oracle.com/marketingcloud/opt-status.html
CrazyEgg CrazyEgg provides visualization of visits to website. https://help.crazyegg.com/article/165-crazy-eggs-gdpr-readiness Opt Out: DAA: https://www.crazyegg.com/opt-out
DemandBase Show targeted, relevant advertisements https://www.demandbase.com/privacy-policy/ Opt out: DAA: http://www.aboutads.info/choices/
LinkedIn Show targeted, relevant advertisements and re-targeted advertisements to visitors of LTI websites https://www.linkedin.com/legal/privacy-policy Opt-out: https://www.linkedin.com/help/linkedin/answer/62931/manage-advertising-preferences
Google Show targeted, relevant advertisements and re-targeted advertisements to visitors of LTI websites https://policies.google.com/privacy Opt Out: https://adssettings.google.com/ NAI: http://optout.networkadvertising.org/ DAA: http://optout.aboutads.info/
Facebook Show targeted, relevant advertisements https://www.facebook.com/privacy/explanation Opt Out: https://www.facebook.com/help/568137493302217
Youtube Show targeted, relevant advertisements. Show embedded videos on LTI websites https://policies.google.com/privacy Opt Out: https://adssettings.google.com/ NAI: http://optout.networkadvertising.org/ DAA: http://optout.aboutads.info/
Twitter Show targeted, relevant advertisements and re-targeted advertisements to visitors of LTI websites https://twitter.com/en/privacy Opt out: https://twitter.com/personalization DAA: http://optout.aboutads.info/
. .avia-table tr {} .avia-table th, .flex_column .avia-table td { color: #343434; padding: 5px !important; border: 1px solid #ddd !important; } .avia-table th {background-color: #addeec;} .avia-table tr:nth-child(odd) td {background-color: #f1f1f1;}
Save settings
Cookies settings