loader image

Revive retail sales with Fosfor + Snowflake + ServiceNow

Reading Time: 7 minutes

There is no question that the COVID-19 pandemic has profoundly impacted the way traditional retailers or new-age eCommerce companies connect with and serve their customers—from capturing their attention online, to integrating service and delivery into a superlative customer experience.

While the topmost concern of retailers in the past might have been securing optimal real estate and square footage, today a vast proportion of the customer’s experience takes place in the increasingly cluttered online arena—an eventuality that was already underway pre-pandemic, which has only been accelerated by seismic shifts in consumer behavior over the past couple of years. Now, the key factors that can make or break a brand are not just accessibility, and availability, but ease of purchase, and speed of service as well.

Despite demonstrating remarkable resilience through various adaptations such as supply chain adjustments, online sales expansions, contactless payments, digital experiences, and personalized services, retailers still have significant opportunities to enhance customer experiences, foster brand loyalty, and provide seamless and satisfactory service.

Concurrently, retailers encounter greater difficulties in managing an intricate IT ecosystem. Unexpected failures in networks or applications can directly affect ongoing business operations, thereby impacting the financial performance of the business. In extreme cases, data and monetary losses resulting from unplanned outages can even lead to the closure of a retailer’s business.

Holistic, yet granular, insights on IT incidents are critical

Amidst this volatile, uncertain, complex, and highly competitive business environment, the demands thrust upon the organization’s IT team by the business have increased significantly, and the trend continues. To cope with the speed and volume of digital transformation projects being rolled out across the organization, and the increased IT incidents that may follow, business and technology leaders require detailed and actionable information – not just on the incidents created, but also on their impact on the organization’s overall performance.

First and foremost, the standard reports generated by SaaS-based applications, like ServiceNow, aren’t fundamentally built for analytics. They do not offer the level of detail required to effectively analyze critical issues surfacing across the entire IT ecosystem. On the other hand, analyzing the (incidents) data in a silo, without really looking at their business impact, can result in recurring incidents, wastage of resources, and excessive spending where it isn’t required.

With Lumin by fosfor ServiceNow Analytics on Snowflake, the business and its IT teams can seamlessly connect with, and delve deeper into the organization’s IT incidents data. With Lumin’s advanced analytical capabilities and Snowflake’s computing prowess, users can proactively spot anomalies, accurately pinpoint the root causes of critical incidents, and align the ITOps spending basis their business impact.

The business need and the data involved

ABC Corporation is a hypothetical omnichannel retailer that sells technology and office supplies to its global clientele through its eCommerce channel. ABC Corporation witnessed robust sales in the last two quarters, viz. Q4 2022 and Q1 2023, however, the sales suddenly plummeted in March and April 2023. Around the same time, IT leaders at ABC noticed a sudden increase in incidents pertaining to technology failures – especially issues with the availability of the portal, payment gateway, etc. As a channel development and category manager, John has been tasked with diagnosing the root cause of increased incidents and corroborating its impact on future sales.

To analyze the problem at hand, John uses Lumin’s native Snowflake connector to connect to the IT incidents data (from ServiceNow), and the sales data (aggregated from the CRM, OMS, and Marketing Information System), both hosted on Snowflake’s data warehouse.

Let us step into John’s shoes as he ingests the data into Snowflake and discovers rich insights using Fosfor Lumin.

Sales data

The sales data is ingested by establishing a traditional ETL pipeline between the source systems (CRM, OMS, and MIS), and aggregating the same on Snowflake. Key attributes include:

  • Key dimensions: Regions, Country, Cities, Category, Brand, etc.
  • Key measures: Sales, Volume, Price, Profit, Promotion, etc.
  • Key date dimensions: Order date

ServiceNow incidents data

ServiceNow incidents data is ingested using Snowflake’s native ServiceNow connector available on the Snowflake marketplace. It connects with, and ingests incident data from the following key tables in ServiceNow into the Snowflake Data Warehouse.

INCIDENT CONTRACT_SLA
CMN_LOCATION SERVICE_OFFERING
SYS_USER SERVICES
SYS_USER_GROUP CONFIG_ITEM
TASK_SLA CORE_COMPANY

As seen in image 1 below, the connector allows John to select the necessary tables from among the 8000+ tables he has access to. The connector syncs with ABC’s ServiceNow instance and autonomously refreshes the data at a set frequency – 24 hours in this case.

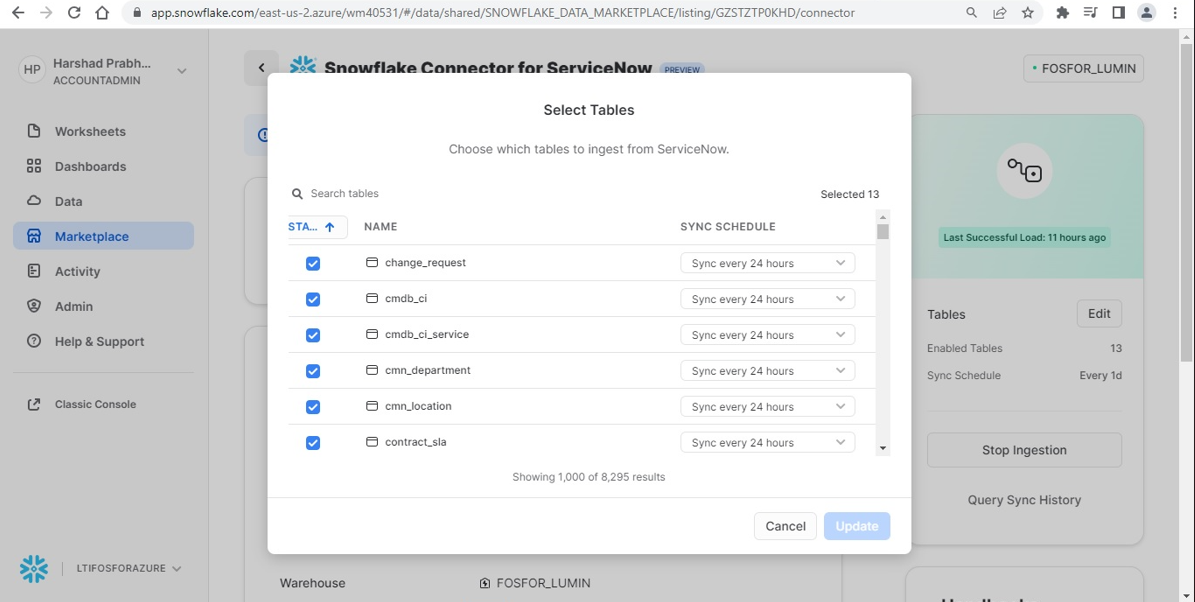
Image 1 – Configuring Snowflake’s native ServiceNow connector

Upon the completion of the necessary configurations, the connector automatically creates a database and a schema as showcased in image 2. Subsequently, it populates the schema with the selected data tables (raw data) and creates corresponding views (flattened data) for analytical consumption.

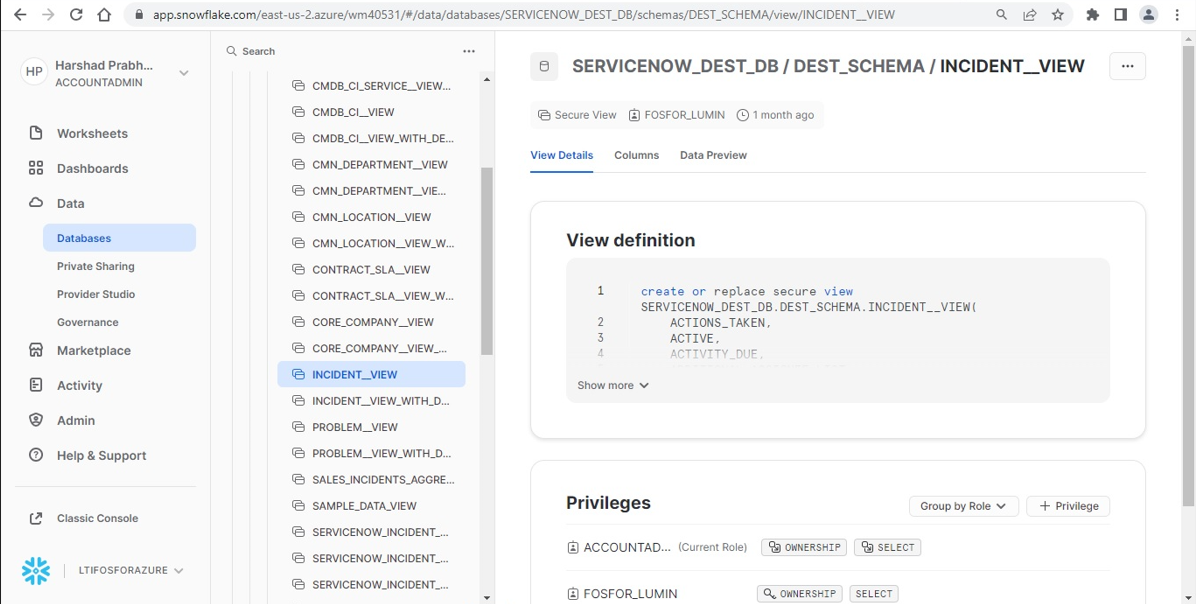
Image 2 – Snowflake’s ServiceNow connector automatically creates the DB, Schema, and tables/views for the selected tables in ServiceNow

Key attributes include:

  • Key dimensions: Category, Assignment Group, Country, Contact Type, Incident State, Closure Code, Priority, Escalation, SLA
    breach, etc.
  • Key Measures and KPIs: Number of incidents, Number of open incidents, Number of incidents resolved, Time to Resolution (TTR),
    Average TTR, Number of incidents opened and resolved the same day, Number of incidents resolved by self-service, etc.
  • Date dimension: Incident Created Date, Incident Opened Date, Incident Resolved Date, Incident Closed Date, etc.

As the next step, John leverages Lumin’s native Snowflake connector to connect to the above Snowflake instance (and the underlying ServiceNow DB and schema that hosts the incidents and sales data) for building this use case solution (see image 3 below).

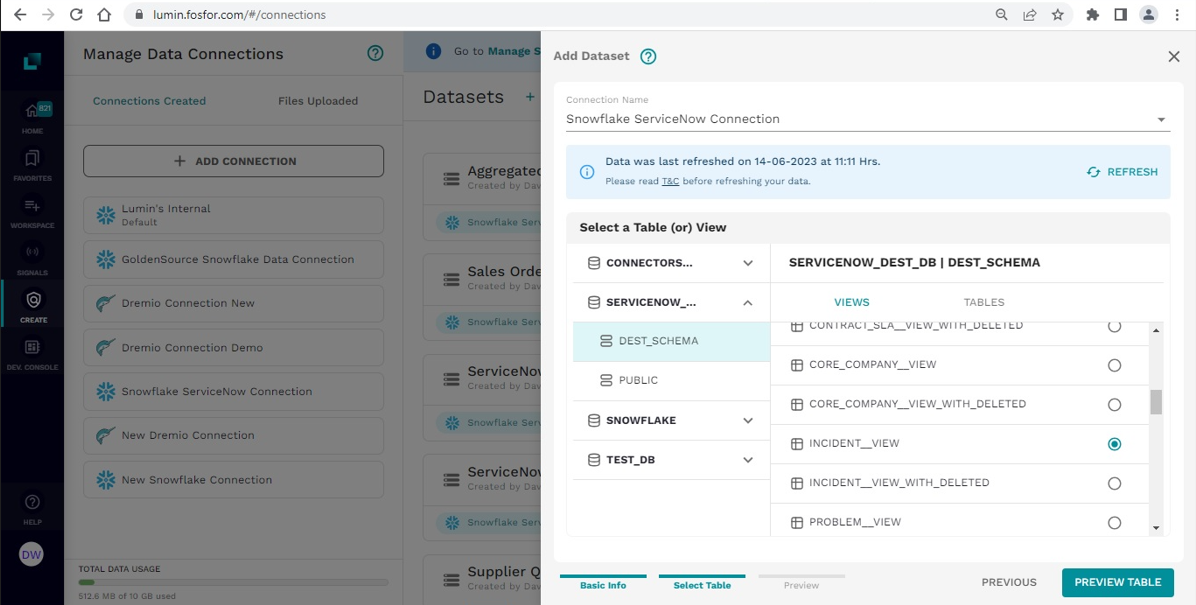
Image 3 – Lumin’s native Snowflake connector seamlessly connects with the ServiceNow data ingested in Snowflake

In this hypothetical demonstration, we can see the differentiated capabilities of Lumin by Fosfor that can provide the CIOs, ITOps professionals, and Service Desk Personnel a holistic view of their entire IT operations with consumer-grade analytics, powered by natural language search and AI.

Descriptive analytics to help you explore the sales and incidents data

John can start his insights exploration journey with a simple descriptive analysis of sales and incidents, particularly looking for their trend in the last year and a half.

In order to arrive at the insights he is looking for, he asks the following in simple language:

Question 1: “What is the trend of sales and incidents in the last 18 months?”

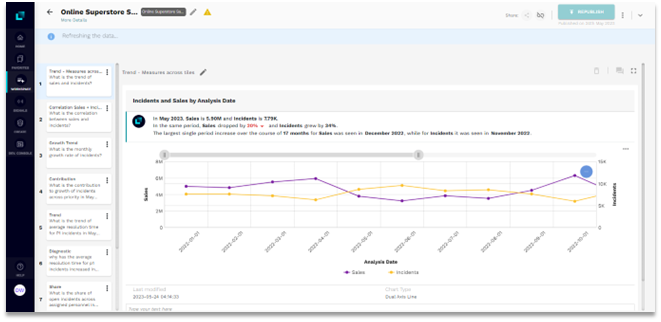
The below image is a representation of the response that Fosfor Lumin would offer John.

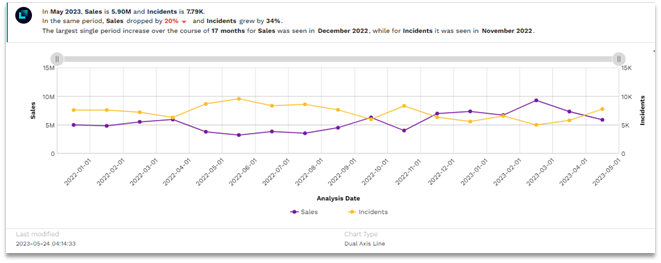
Image 4 – What is the trend of sales and incidents in the last 18 months?

Lumin understood his question in natural language and converted it into an analytical query which, in this case, included the time filter of 18 months. It is interesting to note that the 2 measures, viz. sales, and number of incidents, come from two disparate data tables on Snowflake, but are visualized on the same trend chart. From image 4, it is evident that historically (as well as in April and May 2023), an increase in incidents has resulted in a drop in sales for ABC Corporation. This is interesting, but as a business user, it is important for John to quantify this correlation and potential causation. He can go ahead and ask the question to Fosfor Lumin.

Question 2: “What is the correlation between sales and incidents?”

As expected, Lumin identified a strong negative correlation between sales and incidents with a Pearson correlation coefficient of -0.97 as highlighted in image 5. It is worth noting that Lumin not only selected the best-fit visualization to represent the insight but also generated a contextualized narrative, in English, to explain the same.

Though correlation is a measure of association and not causality, it is very likely that in this business context, an increase in incidents can lead to a loss in sales which needs further investigation.

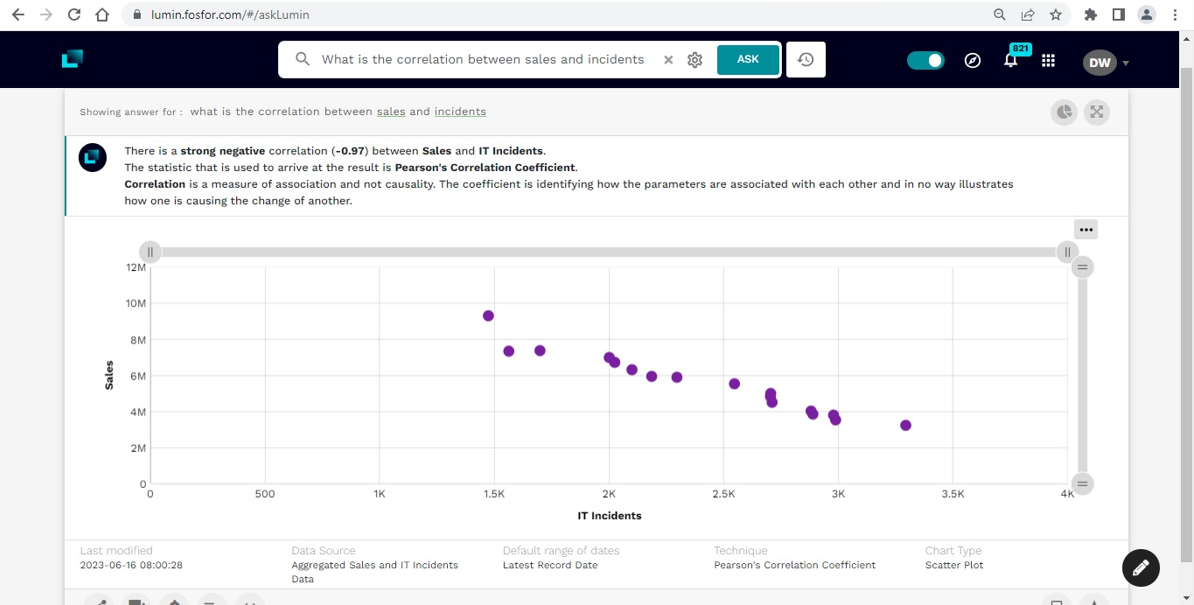
Image 5 – What is the correlation between sales and incidents?

As the next step in the investigative journey, John can further do a deep dive into incidents and look for its growth trend.

Question 3: “What is the monthly growth rate of incidents?”

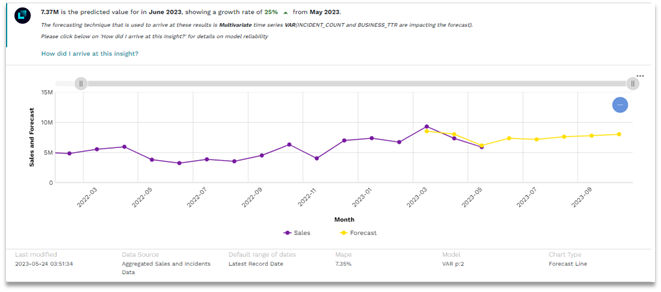
As you can see in image 6, Lumin by Fosfor understands the intent of the question and presents not only the trend of incidents, but also the M-o-M growth. Clearly, the rate of growth of incidents has shown an uptrend since March 2023, with the incidents growing by ~35% in May 2023.

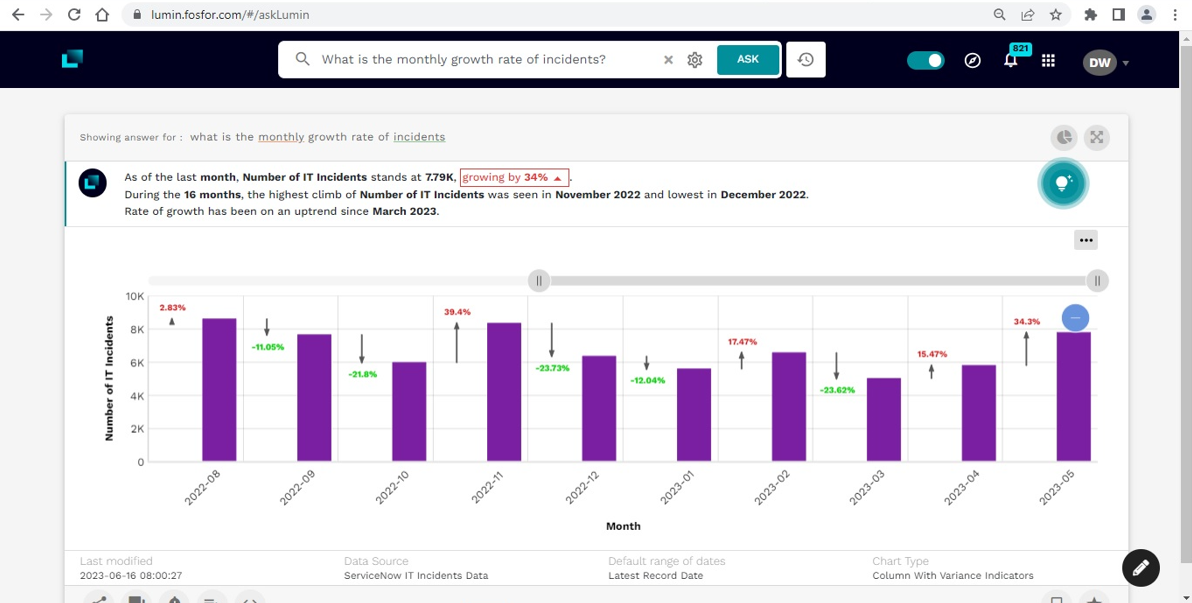
Image 6 – What is the monthly growth rate of incidents?

Lumin provides John with some powerful personalization and collaboration features that allows him to:

  • Export the underlying data.
  • Switch the charts (as per his liking) from across a library of charts suitable for representing the insight.
  • Share the insights with his colleagues within the organization.
  • Add comments (his understanding, observations, POV, etc.) on the insights while he collaborates with a larger team.
  • Create personalized alerts and signals to better track the metrics or KPIs, and get notified when they breach a user-defined threshold.
  • Capture the insights, as he goes about his exploratory journey, in an insights storyboard called a workspace. The workspace can also be shared with his colleagues within the organization.

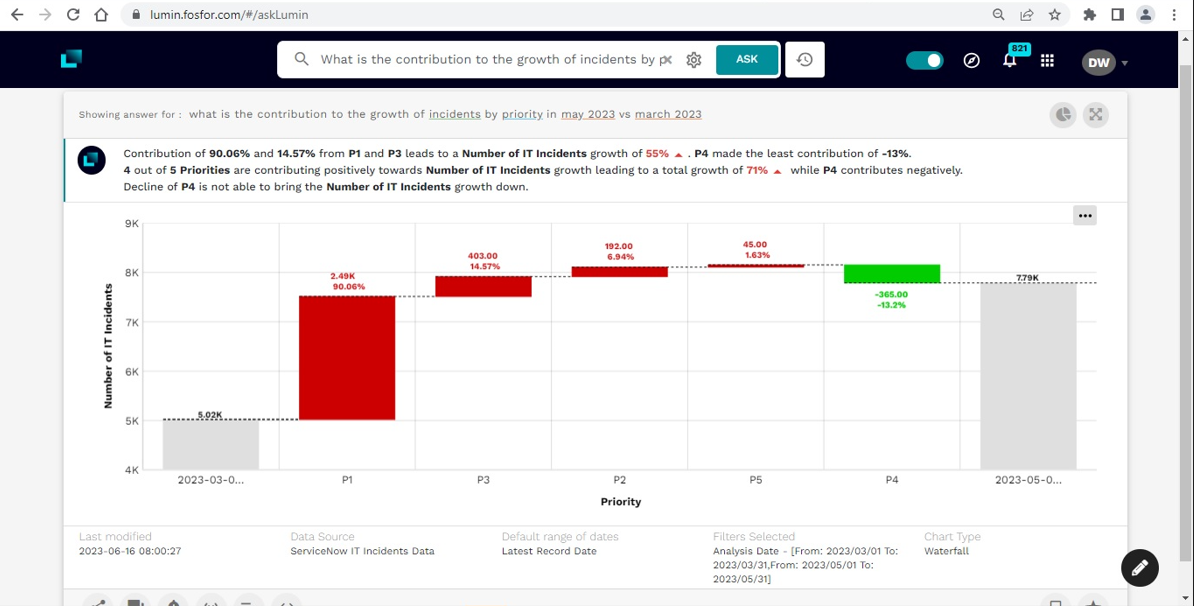
The sudden increase in incidents since March 2023 is a sign of worry; however, it is important to understand how the incidents stack up, based on their priority. High priority incidents (P1) have a greater business impact as compared to a low priority incident (P5). John can ask Lumin this fairly complex question in simple conversational English.

Question 4: “What is the contribution to the growth of incidents by priority in May 2023 vs March 2023?”

As illustrated in the waterfall chart in image 7, priority 1 incidents have contributed the most (~90%) in the growth of incidents in May 2023 as compared to March 2023. That is certainly not a great sign, but solely looking at the volume of incidents is not enough.

Image 7 – What is the contribution to the growth of incidents by priority in May 2023 vs March 2023?

John can additionally look at the average time it took the IT team to resolve the P1 incidents, and whether there was an upward or a downward trend.

Question 5: “What is the trend of average resolution time for P1 incidents in May 2023 vs March 2023?”

Clearly, the resolution time in hours for P1 incidents has doubled in May 2023 (as seen in image 8), significantly breaching the SLA threshold of 8 hours. Hence, it is evident that the IT support team has not been able to efficiently resolve the increased number of tickets, thereby allowing them to pile up. It is important for John to diagnose the increase in the resolution time, and identify key contributing attributes.

Image 8 – What is the trend of average resolution time for P1 incidents in May 2023 vs March 2023?

Go beyond insights to reveal the “why”

On clicking on the connected insights, John is provided by Lumin with a set of simple and advanced analytical questions closely related to the metric or KPI that we are exploring – average resolution time, in this case. As seen in image 9 below, Fosfor Lumin has proactively nudged John to ask the “Why” question, in order to diagnose the increase in the average resolution time for P1 incidents. The diagnostic capabilities of Lumin can help him uncover the key contributing dimensional attributes that affect the change, like geography, business service, assignment group, etc., without asking multiple follow-up questions, making the investigative journey highly efficient.

Image 9 – Connected insights

Question 6: “Why did the average resolution time for P1 incidents increase in May 2023 vs March 2023?”

As seen in image 10 (a), Lumin performs a cross-dimensional analysis of average resolution time which includes the geographical hierarchy (region, country), assignment group, incident category, business services, and contact type, apart from the priority that was already analyzed. In a matter of a few seconds, Fosfor Lumin presents a detailed narrative along with an interactive bubble chart that presents a deep-dive analysis across multiple dimensional attributes.

As an example, from a business services standpoint, let’s assume that the Supply Chain Management System contributed the most to the increase in the total resolution time. It was followed by the eCommerce portal availability and point-of-sale payment system. Similarly, from an incidents category perspective, most of the time was spent resolving incidents pertaining to network and database-related incidents. Image 10 (b) shows us how Lumin offers a visual representation of the same data.

Image 10 (a) – Why did the average resolution time for P1 incidents increase in May 2023 vs March 2023?

Image 10 (b) – Why did the average resolution time for P1 incidents increase in May 2023 vs March 2023?

Now as a user, John can very well question these findings. Hence, Lumin’s explainability layer, as illustrated in image 11, becomes very important. It provides us with explanations on how it arrived at these insights – what was the input data, the data’s sanity, the model applied, the model’s interpretation, the model’s reliability, etc.

Image 11 – Explanation of insights

With a high average time to resolution in April and May 2023 (Q2 2023), there ought to be a high number of open incidents that are awaiting resolution. John can delve a bit deeper to identify the personnel who are assigned to the open incidents and in what proportion they share the backlog.

Question 7: “What is the share of open incidents across assigned personnel in Q2 2023?”

Image 12 – What is the share of open incidents across assigned personnel in Q2 2023?

It is evident from image 12 that Carla S, Carla F, and Cherie S together are assigned close to 75% of the open incidents. The other 9 team members are managing the remainder 25% of the backlog – which seems to be skewed. Workload management could be a potential reason for the higher resolution time and open incidents.

Never miss a critical change in your IT incident / ITOps KPIs with autonomous nudges

John can continue asking more questions. He can probe the data for more deep-dive analyses across various dimensions. However, what about the questions that he did not ask and insights that he did not seek? What if Fosfor Lumin could have autonomously detected and nudged him on anomalistic trends without him asking those questions? Can this be possible? Yes, Lumin can spot deviations in the data as they happen with fully automated ‘nudges.’ Lumin’s anomaly engine synthesizes millions of data points in seconds to inform us of important changes as they happen. It detects what had shifted, when, why , and by how much this occured.

Here, John has set up autonomous nudges on some of the key KPIs that he is tracking – viz. sales, number of incidents, and average resolution time. He has configured it to look for anomalistic behavior in those KPIs across the geographical hierarchy comprising regions, and countries. As seen in image 13, Lumin, leveraging its built-in machine learning algorithms, proactively detected the sudden increase in average resolution time in Canada.

Image 13 – Example for autonomous nudges

Get a sneak peek into future sales using predictive analytics

Having analyzed the incidents, it will be crucial for John to understand how sales will trend in the next few months, given the historical trend and the impact of potential incidents. This will help John gain *improved visibility into future business performance, and get the team ready to effectively manage any such incidents.

Question 8: “What will be the sales in the next 6 months?”

Image 13 – What will be the sales in the next 6 months?

Lumin understands that John is asking it to predict the sales. In turn, it runs multiple multivariate forecasting models under the hood, and presents the most accurate model as an output. For his question, as seen in image 13, Lumin by Fosfor selected the Multivariate Time Series Vector Autoregressive (VAR) model for predicting sales, and it also identified the incidents as the key drivers impacting the forecast.

As seen before, to ensure trust and transparency, Lumin provides a detailed explanation of the input data, the data’s sanity, the prediction models(including accuracy), and how John can interpret the reliability of those models(as shown in image 14).

Image 14 – Explainability of forecast

However, as a business user, John is aware that the number of incidents is expected to increase in the next three months, post which they may taper down. It would be vital for him to factor that increase into the forecast to make realistic plans.
John can run a forecast simulation by increasing the number of incidents (based on the incident forecast) in the next three months by 15% and subsequently reducing them by 15%. This strategy is highlighted in Image 15.

Image 15 – Forecast simulation – updating the driver for the simulation

Image 16 – Forecast simulation

As can be seen in image 16, Lumin by Fosfor factored-in the change in the number of incidents and reworked the forecast for John. The forecasted values have increased compared to the earlier forecast. This is significantly more realistic and closer to what the business could expect.

It is worth noting that Lumin uses Snowpark to run intense analytical workloads – like diagnostics, simulations, and forecasts – thereby providing users with an ability to dynamically query and process their data within the Snowflake environment.

Create, curate, and collaborate on your insight story

The purpose of the entire analysis that John performed is not to merely ask questions but to tell an insightful insights story that can be shared with the relevant stakeholders across the organization. Lumin, through the workspace storyboards, enables users to seamlessly create, curate and collaborate with colleagues in the organization.

As John traverses through his insights exploration journey, he can create a personalized workspace, as showcased in Image 17, and add his discovered insights to that workspace. Once the analysis is complete, he can visit the workspace to refine or curate his story, add comments, etc., before publishing it to the stakeholders. Also, once published, the workspace is refreshed every time the underlying data is refreshed.

Image 17 – Workspace

Lumin: The ServiceNow incident analytics solution

As we have showcased above, Lumin delivers value across the retail/eCommerce industry’s business and IT operation teams with unified analytics experience across relevant data sources. It can curate answers faster and present it with a Google-like conversational interface. It explains business metric changes and how to improve business outcomes by understanding the drivers of those behaviors.

Learn more with about Lumin by Fosfor.

Author

Harshad Prabhudesai

Senior Manager (DI Solutions), Fosfor

Harshad brings over a decade of rich and diverse experience in manufacturing, heavy engineering, and technology. His core expertise lies in designing high-impact technology solutions for use cases across the manufacturing value chain. He holds an MBA from the Indian Institute of Management, Udaipur, and a bachelor’s degree in mechanical engineering from the College of Engineering, Pune. As a Senior Specialist at Fosfor, Harshad is responsible for architecting augmented analytics solutions for manufacturing organizations and helping them accelerate their data-to-decisions journeys.

More on the topic

Read more thought leadership from our team of experts

How can Retail and CPG companies utilize ChatGPT and Generative AI

OpenAI, an American artificial intelligence research laboratory, released ChatGPT on 30 November 2022, and there has been an uptick in interest around the world on AI-generated text, AI-generated images, and AI-generated video ever since. This interest has gained traction over time, fueled by the potential for it to change our lives forever - professional and personal alike.

Read more

Introduction to Decision Intelligence and its tools

The pandemic has completely transformed the way we live life and do business. Over the last two years, we have learned how important it is to be flexible and agile in our decision-making. According to a recent survey by Gartner, "65% of respondents said the decisions they make are more complex than just two years ago, and 53% said they face more pressure to explain or justify their decisions."

Read more

Harnessing the power of Lumin and Streamlit in Snowflake: From data exploration and visualization to Decision Intelligence

As a data enthusiast myself, I understand the importance of data exploration, visualization, and decision intelligence in today's data driven world. That is why I am thrilled to share with you how Lumin and Streamlit can revolutionize your data analysis experience in Snowflake, the leading cloud-based data warehouse platform. So, fasten your seatbelts as we embark on a journey to harness the true power of Lumin and Streamlit to unlock the potential of your data.

Read more
We use cookies to personalise content and ads, to provide social media features and to analyse our traffic. We also share information about your use of our site with our social media, advertising and analytics partners. View more
Cookies settings
Accept
Privacy & Cookie policy
Privacy & Cookies policy
Cookie name Active

What is a cookie?

A cookie is a small piece of data that a website asks your browser to store on your computer or mobile device. The cookie allows the website to “remember” your actions or preferences over time. On future visits, this data is then returned to that website to help identify you and your site preferences. Our websites and mobile sites use cookies to give you the best online experience. Most Internet browsers support cookies; however, users can set their browsers to decline certain types of cookies or specific cookies. Further, users can delete cookies at any time.

Why do we use cookies?

We use cookies to learn how you interact with our content and to improve your experience when visiting our website(s). For example, some cookies remember your language or preferences so that you do not have to repeatedly make these choices when you visit one of our websites.

What kind of cookies do we use?

We use the following categories of cookie:

Category 1: Strictly Necessary Cookies

Strictly necessary cookies are those that are essential for our sites to work in the way you have requested. Although many of our sites are open, that is, they do not require registration; we may use strictly necessary cookies to control access to some of our community sites, whitepapers or online events such as webinars; as well as to maintain your session during a single visit. These cookies will need to reset on your browser each time you register or log in to a gated area. If you block these cookies entirely, you may not be able to access gated areas. We may also offer you the choice of a persistent cookie to recognize you as you return to one of our gated sites. If you choose not to use this “remember me” function, you will simply need to log in each time you return.
Cookie Name Domain / Associated Domain / Third-Party Service Description Retention period
__cfduid Cloudflare Cookie associated with sites using CloudFlare, used to speed up page load times 1 Year
lidc linkedin.com his is a Microsoft MSN 1st party cookie that ensures the proper functioning of this website. 1 Day
PHPSESSID lntinfotech.com Cookies named PHPSESSID only contain a reference to a session stored on the web server When the browsing session ends
catAccCookies lntinfotech.com Cookie set by the UK cookie consent plugin to record that you accept the fact that the site uses cookies. 29 Days
AWSELB Used to distribute traffic to the website on several servers in order to optimise response times. 2437 Days
JSESSIONID linkedin.com Preserves users states across page requests. 334,416 Days
checkForPermission bidr.io Determines whether the visitor has accepted the cookie consent box. 1 Day
VISITOR_INFO1_LIVE Tries to estimate users bandwidth on the pages with integrated YouTube videos. 179 Days
.avia-table-1 td:nth-of-type(1):before { content: 'Cookie Name'; } .avia-table-1 td:nth-of-type(2):before { content: 'Domain / Associated Domain / Third-Party Service'; } .avia-table-1 td:nth-of-type(3):before { content: 'Description'; } .avia-table-1 td:nth-of-type(4):before { content: 'Retention period'; }

Category 2: Performance Cookies

Performance cookies, often called analytics cookies, collect data from visitors to our sites on a unique, but anonymous basis. The results are reported to us as aggregate numbers and trends. LTI allows third-parties to set performance cookies. We rely on reports to understand our audiences, and improve how our websites work. We use Google Analytics, a web analytics service provided by Google, Inc. (“Google”), which in turn uses performance cookies. Information generated by the cookies about your use of our website will be transmitted to and stored by Google on servers Worldwide. The IP-address, which your browser conveys within the scope of Google Analytics, will not be associated with any other data held by Google. You may refuse the use of cookies by selecting the appropriate settings on your browser. However, you have to note that if you do this, you may not be able to use the full functionality of our website. You can also opt-out from being tracked by Google Analytics from any future instances, by downloading and installing Google Analytics Opt-out Browser Add-on for your current web browser: https://tools.google.com/dlpage/gaoptout & cookiechoices.org and privacy.google.com/businesses
Cookie Name Domain / Associated Domain / Third-Party Service Description Retention period
_ga lntinfotech.com Used to identify unique users. Registers a unique ID that is used to generate statistical data on how the visitor uses the web site. 2 years
_gid lntinfotech.com This cookie name is asssociated with Google Universal Analytics. This appears to be a new cookie and as of Spring 2017 no information is available from Google. It appears to store and update a unique value for each page visited. 1 day
_gat lntinfotech.com Used by Google Analytics to throttle request rate 1 Day
.avia-table-2 td:nth-of-type(1):before { content: 'Cookie Name'; } .avia-table-2 td:nth-of-type(2):before { content: 'Domain / Associated Domain / Third-Party Service'; } .avia-table-2 td:nth-of-type(3):before { content: 'Description'; } .avia-table-2 td:nth-of-type(4):before { content: 'Retention period'; }

Category 3: Functionality Cookies

We may use site performance cookies to remember your preferences for operational settings on our websites, so as to save you the trouble to reset the preferences every time you visit. For example, the cookie may recognize optimum video streaming speeds, or volume settings, or the order in which you look at comments to a posting on one of our forums. These cookies do not identify you as an individual and we don’t associate the resulting information with a cookie that does.
Cookie Name Domain / Associated Domain / Third-Party Service Description Retention period
lang ads.linkedin.com Set by LinkedIn when a webpage contains an embedded “Follow us” panel. Preference cookies enable a website to remember information that changes the way the website behaves or looks, like your preferred language or the region that you are in. When the browsing session ends
lang linkedin.com In most cases it will likely be used to store language preferences, potentially to serve up content in the stored language. When the browsing session ends
YSC Registers a unique ID to keep statistics of what videos from Youtube the user has seen. 2,488,902 Days
.avia-table-3 td:nth-of-type(1):before { content: 'Cookie Name'; } .avia-table-3 td:nth-of-type(2):before { content: 'Domain / Associated Domain / Third-Party Service'; } .avia-table-3 td:nth-of-type(3):before { content: 'Description'; } .avia-table-3 td:nth-of-type(4):before { content: 'Retention period'; }

Category 4: Social Media Cookies

If you use social media or other third-party credentials to log in to our sites, then that other organization may set a cookie that allows that company to recognize you. The social media organization may use that cookie for its own purposes. The Social Media Organization may also show you ads and content from us when you visit its websites.

Ref links:

LinkedInhttps://www.linkedin.com/legal/privacy-policy Twitterhttps://gdpr.twitter.com/en.html & https://twitter.com/en/privacy & https://help.twitter.com/en/rules-and-policies/twitter-cookies Facebookhttps://www.facebook.com/business/gdpr Also, if you use a social media-sharing button or widget on one of our sites, the social network that created the button will record your action for its own purposes. Please read through each social media organization’s privacy and data protection policy to understand its use of its cookies and the tracking from our sites, and also how to control such cookies and buttons.

Category 5: Targeting/Advertising Cookies

We use tracking and targeting cookies, or ask other companies to do so on our behalf, to send you emails and show you online advertising, which meet your business and professional interests. If you have registered on our websites, we may send you emails, tailored to reflect the interests you have shown during your visits. We ask third-party advertising platforms and technology companies to show you our ads after you leave our sites (retargeting technology). This technology allows us to make our website services more interesting for you. Retargeting cookies are used to record anonymized movement patterns on a website. These patterns are used to tailor banner advertisements to your interests. The data used for retargeting is completely anonymous, and is only used for statistical analysis. No personal data is stored, and the use of the retargeting technology is subject to the applicable statutory data protection regulations. We also work with companies to reach people who have not visited our sites. These companies do not identify you as an individual, instead rely on a variety of other data to show you advertisements, for example, behavior across websites, information about individual devices, and, in some cases, IP addresses. Please refer below table to understand how these third-party websites collect and use information on our behalf and read more about their opt out options.
Cookie Name Domain / Associated Domain / Third-Party Service Description Retention period
BizoID ads.linkedin.com These cookies are used to deliver adverts more relevant to you and your interests 183 days
iuuid demandbase.com Used to measure the performance and optimization of Demandbase data and reporting 2 years
IDE doubleclick.net This cookie carries out information about how the end user uses the website and any advertising that the end user may have seen before visiting the said website. 2,903,481 Days
UserMatchHistory linkedin.com This cookie is used to track visitors so that more relevant ads can be presented based on the visitor’s preferences. 60,345 Days
bcookie linkedin.com This is a Microsoft MSN 1st party cookie for sharing the content of the website via social media. 2 years
__asc lntinfotech.com This cookie is used to collect information on consumer behavior, which is sent to Alexa Analytics. 1 Day
__auc lntinfotech.com This cookie is used to collect information on consumer behavior, which is sent to Alexa Analytics. 1 Year
_gcl_au lntinfotech.com Used by Google AdSense for experimenting with advertisement efficiency across websites using their services. 3 Months
bscookie linkedin.com Used by the social networking service, LinkedIn, for tracking the use of embedded services. 2 years
tempToken app.mirabelsmarketingmanager.com When the browsing session ends
ELOQUA eloqua.com Registers a unique ID that identifies the user’s device upon return visits. Used for auto -populating forms and to validate if a certain contact is registered to an email group . 2 Years
ELQSTATUS eloqua.com Used to auto -populate forms and validate if a given contact has subscribed to an email group. The cookies only set if the user allows tracking . 2 Years
IDE doubleclick.net Used by Google Double Click to register and report the website user’s actions after viewing clicking one of the advertiser’s ads with the purpose of measuring the efficiency of an ad and to present targeted ads to the user. 1 Year
NID google.com Registers a unique ID that identifies a returning user’s device. The ID is used for targeted ads. 6 Months
PREF youtube.com Registers a unique ID that is used by Google to keep statistics of how the visitor uses YouTube videos across different web sites. 8 months
test_cookie doubleclick.net This cookie is set by DoubleClick (which is owned by Google) to determine if the website visitor’s browser supports cookies. 1,073,201 Days
UserMatchHistory linkedin.com Used to track visitors on multiple websites, in order to present relevant advertisement based on the visitor’s preferences. 29 days
VISITOR_INFO1_LIVE youtube.com 179 days
.avia-table-4 td:nth-of-type(1):before { content: 'Cookie Name'; } .avia-table-4 td:nth-of-type(2):before { content: 'Domain / Associated Domain / Third-Party Service'; } .avia-table-4 td:nth-of-type(3):before { content: 'Description'; } .avia-table-4 td:nth-of-type(4):before { content: 'Retention period'; }
Third party companies Purpose Applicable Privacy/Cookie Policy Link
Alexa Show targeted, relevant advertisements https://www.oracle.com/legal/privacy/marketing-cloud-data-cloud-privacy-policy.html To opt out: http://www.bluekai.com/consumers.php#optout
Eloqua Personalized email based interactions https://www.oracle.com/legal/privacy/marketing-cloud-data-cloud-privacy-policy.html To opt out: https://www.oracle.com/marketingcloud/opt-status.html
CrazyEgg CrazyEgg provides visualization of visits to website. https://help.crazyegg.com/article/165-crazy-eggs-gdpr-readiness Opt Out: DAA: https://www.crazyegg.com/opt-out
DemandBase Show targeted, relevant advertisements https://www.demandbase.com/privacy-policy/ Opt out: DAA: http://www.aboutads.info/choices/
LinkedIn Show targeted, relevant advertisements and re-targeted advertisements to visitors of LTI websites https://www.linkedin.com/legal/privacy-policy Opt-out: https://www.linkedin.com/help/linkedin/answer/62931/manage-advertising-preferences
Google Show targeted, relevant advertisements and re-targeted advertisements to visitors of LTI websites https://policies.google.com/privacy Opt Out: https://adssettings.google.com/ NAI: http://optout.networkadvertising.org/ DAA: http://optout.aboutads.info/
Facebook Show targeted, relevant advertisements https://www.facebook.com/privacy/explanation Opt Out: https://www.facebook.com/help/568137493302217
Youtube Show targeted, relevant advertisements. Show embedded videos on LTI websites https://policies.google.com/privacy Opt Out: https://adssettings.google.com/ NAI: http://optout.networkadvertising.org/ DAA: http://optout.aboutads.info/
Twitter Show targeted, relevant advertisements and re-targeted advertisements to visitors of LTI websites https://twitter.com/en/privacy Opt out: https://twitter.com/personalization DAA: http://optout.aboutads.info/
. .avia-table tr {} .avia-table th, .flex_column .avia-table td { color: #343434; padding: 5px !important; border: 1px solid #ddd !important; } .avia-table th {background-color: #addeec;} .avia-table tr:nth-child(odd) td {background-color: #f1f1f1;}
Save settings
Cookies settings